
Free public transport changed how Victorians travelled. But did it get people out of their cars?
A survey of 1,028 Victorians and traffic data from five major Melbourne corridors reveal a more complex picture than many expected.

f11photo/Adobe Stock 271299658
Over the past two months I have been monitoring Victoria’s free public transport initiative using multiple data sources, including a statewide travel survey of 1,028 residents and traffic monitoring data from five major Melbourne transport corridors.
With the free fare period now complete and a 50% fare discount remaining in place for the rest of 2026, this article presents some of the first evidence on how Victorians responded to the policy.
Victoria’s two-month free public transport initiative has now come to an end.
Introduced during the fuel price shock, the policy was designed primarily as a cost-of-living measure, helping households cope with rising transport costs.
But it also raised an important question: could free public transport persuade Victorians to drive less and rely more on public transport?
To find out, I analysed traffic volumes on five major Melbourne transport corridors and surveyed 1,028 Victorian residents during the policy period.
The results suggest free public transport did change travel behaviour, but its effect on road traffic was uneven and more modest than many people might expect.
More people used public transport
The survey found almost 40% of respondents increased their public transport use during the free period.
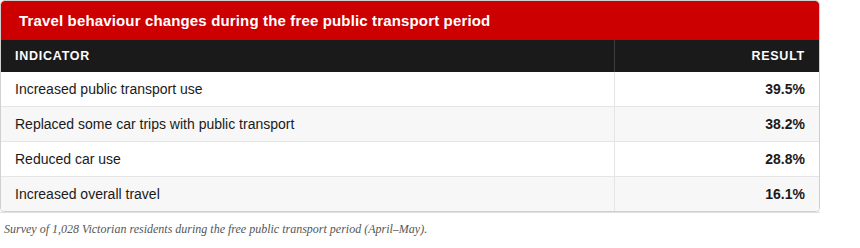
The survey paints a picture of substantial behavioural change, although not necessarily a wholesale shift away from private vehicles. Just over 38% said they had replaced at least some car trips with public transport, while almost 29% reported reducing their overall car use.
Many respondents said free fares encouraged them to make trips they might otherwise have postponed, including social, recreational and discretionary travel.
Free public transport was the single most common reason people gave for changing their travel behaviour. However, rising fuel prices were almost as influential, suggesting the behavioural response was driven by a combination of factors rather than free fares alone.
Did traffic fall?
To answer this question, traffic volumes were analysed across five major Melbourne corridors: the Eastern Freeway, Monash Freeway, Nepean Highway corridor, Tullamarine Freeway and West Gate corridor.
Traffic volumes during the free public transport period (April and May) were compared with matched March baseline conditions while accounting for weekdays, school holidays and Easter effects.
Four of the five monitored corridors recorded lower traffic volumes than their matched March baseline.
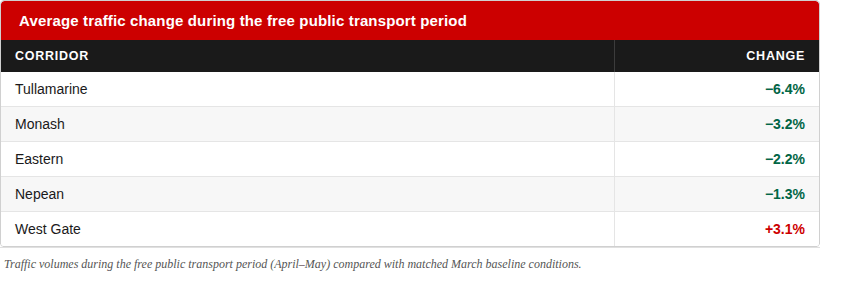
The largest reduction occurred on the Tullamarine corridor, where traffic volumes were around 6% lower than baseline conditions.
The West Gate corridor was the exception, recording slightly higher traffic volumes than expected. This may reflect freight, logistics and port-related activity, sectors where travel demand is generally less responsive to changes in public transport fares.
Looking beyond percentages
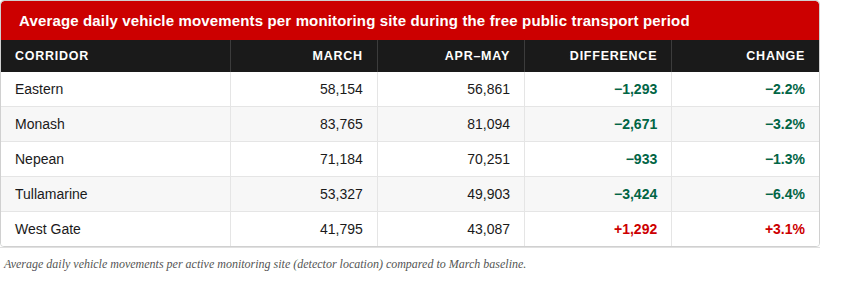
Percentage changes can sometimes sound small. Looking at actual traffic volumes helps show the scale of change occurring on Melbourne's road network.
The largest reduction occurred on the Tullamarine corridor – traffic volumes were around 6.4% lower than in March, equivalent to roughly 3,400 fewer vehicle movements per monitoring site per day. Monash also recorded substantial reductions, while Eastern and Nepean showed smaller declines. West Gate was the only corridor where traffic volumes exceeded baseline conditions.
Where were the biggest changes?
The traffic reductions were not evenly distributed.
Weekday commuting periods showed only modest changes, suggesting most people continued to rely on cars for regular work trips.

The strongest and most consistent reductions occurred on the Tullamarine corridor, where traffic volumes were lower on every day of the week.
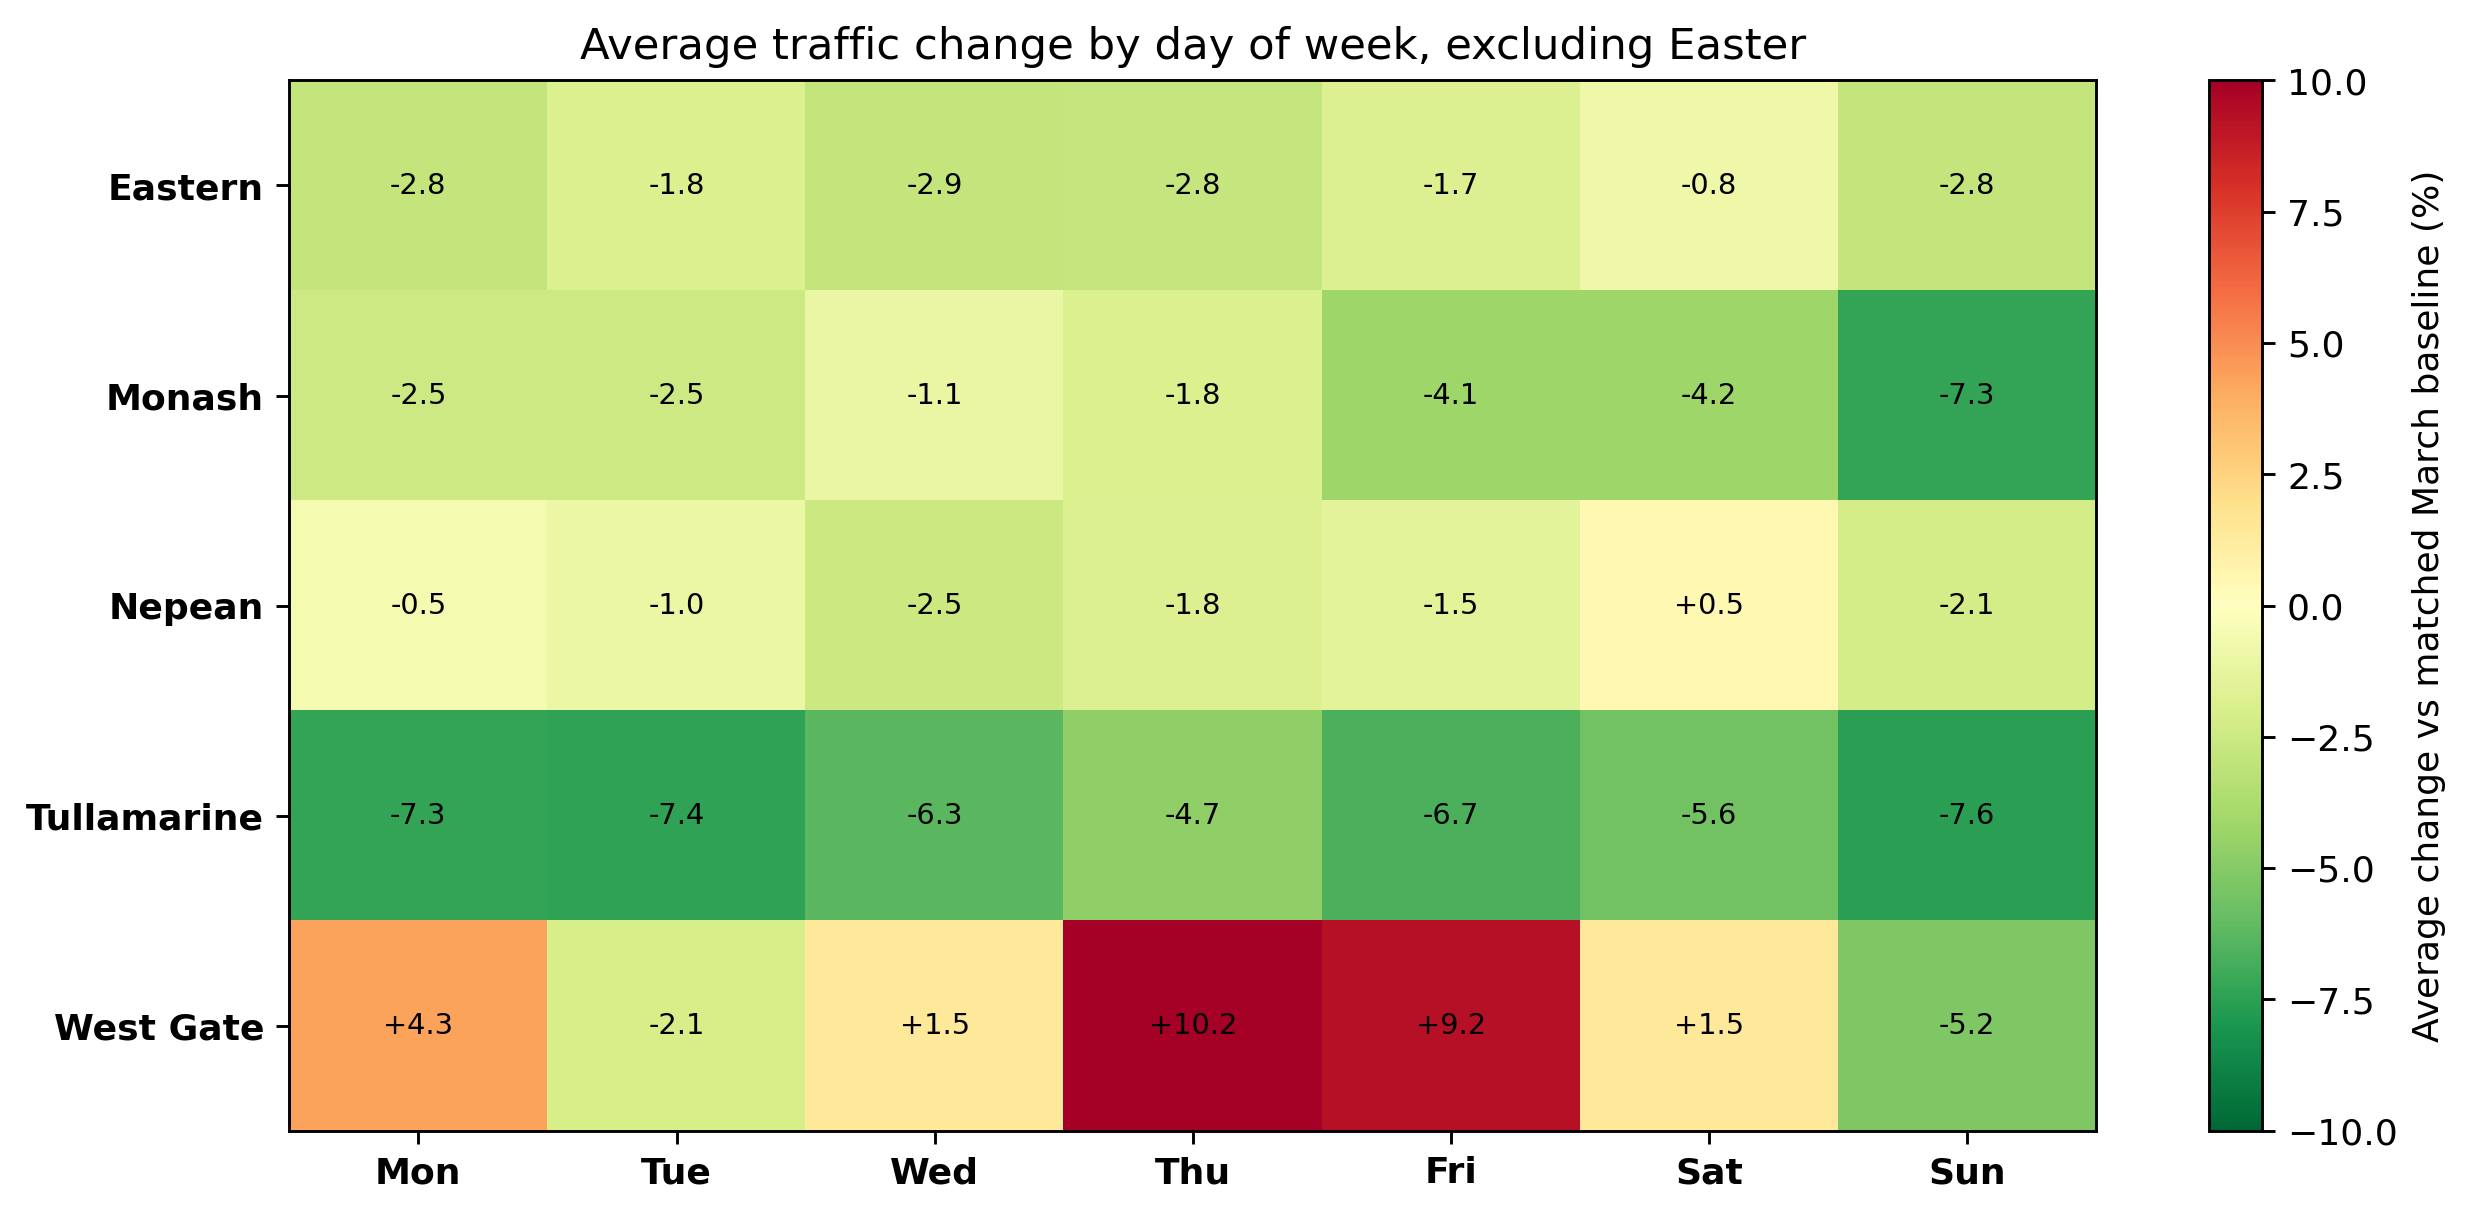
By contrast, the West Gate corridor displayed a very different pattern, highlighting how the impacts of the policy varied across Melbourne’s transport network.
What did people think?
The survey responses suggest free public transport was broadly welcomed.
More than three-quarters of respondents (77.4%) supported affordable public transport measures during periods of economic pressure.
Many comments highlighted savings on transport costs, easier access to jobs and education, and the ability to travel more frequently.
Some respondents described using public transport for trips they would normally avoid because of fuel costs, while others said the policy encouraged them to explore parts of Melbourne they would not otherwise have visited.
However, the policy also exposed some long-standing concerns.
The most common criticisms involved overcrowding, service frequency and reliability. Some older respondents expressed frustration about standing for extended periods and a perception that seating etiquette had deteriorated on crowded services.
This suggests that attracting new passengers is only part of the challenge. Maintaining service quality is equally important if people are expected to continue using public transport once fares return.
Full methodology, technical notes, figures and project updates are available at: https://github.com/hdia/victoria_free_public_transport_2026